CatalogHub / CRM for online + offline
Product flow · partner brief

Every store, every order, every customer — in one CRM.

A customer walks into any of your stores and buys. That bill flows from your existing POS into CatalogHub. A customer orders on your website — that lands in the same place. From there you see everything across branches, and you reach those customers on WhatsApp, Meta and Google.

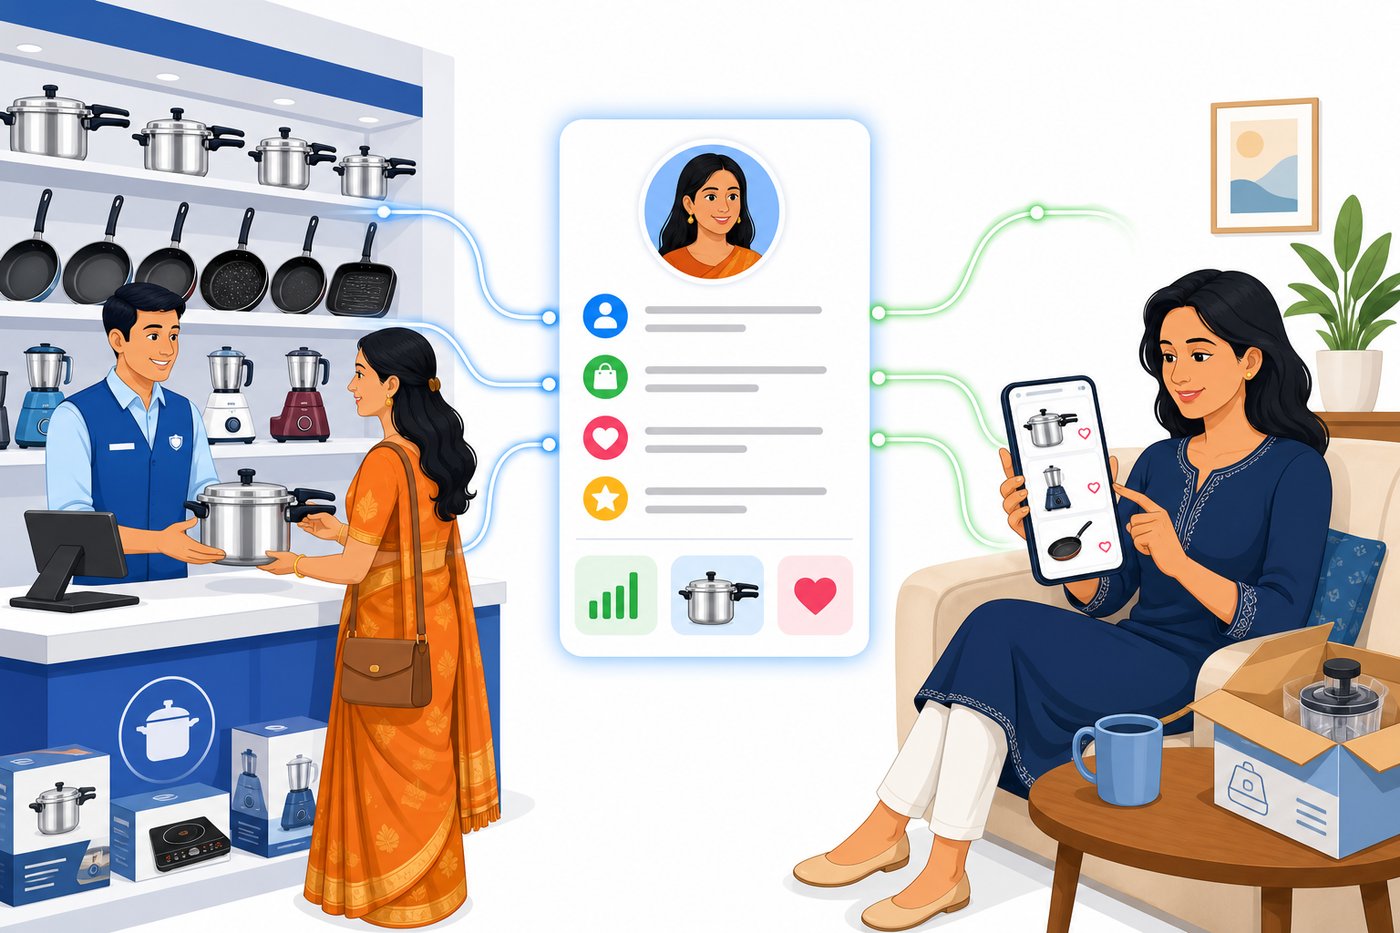
Illustration: a jewellery showroom counter and a customer shopping on her phone, both linked into one customer profile card.

OverviewThe story in three steps
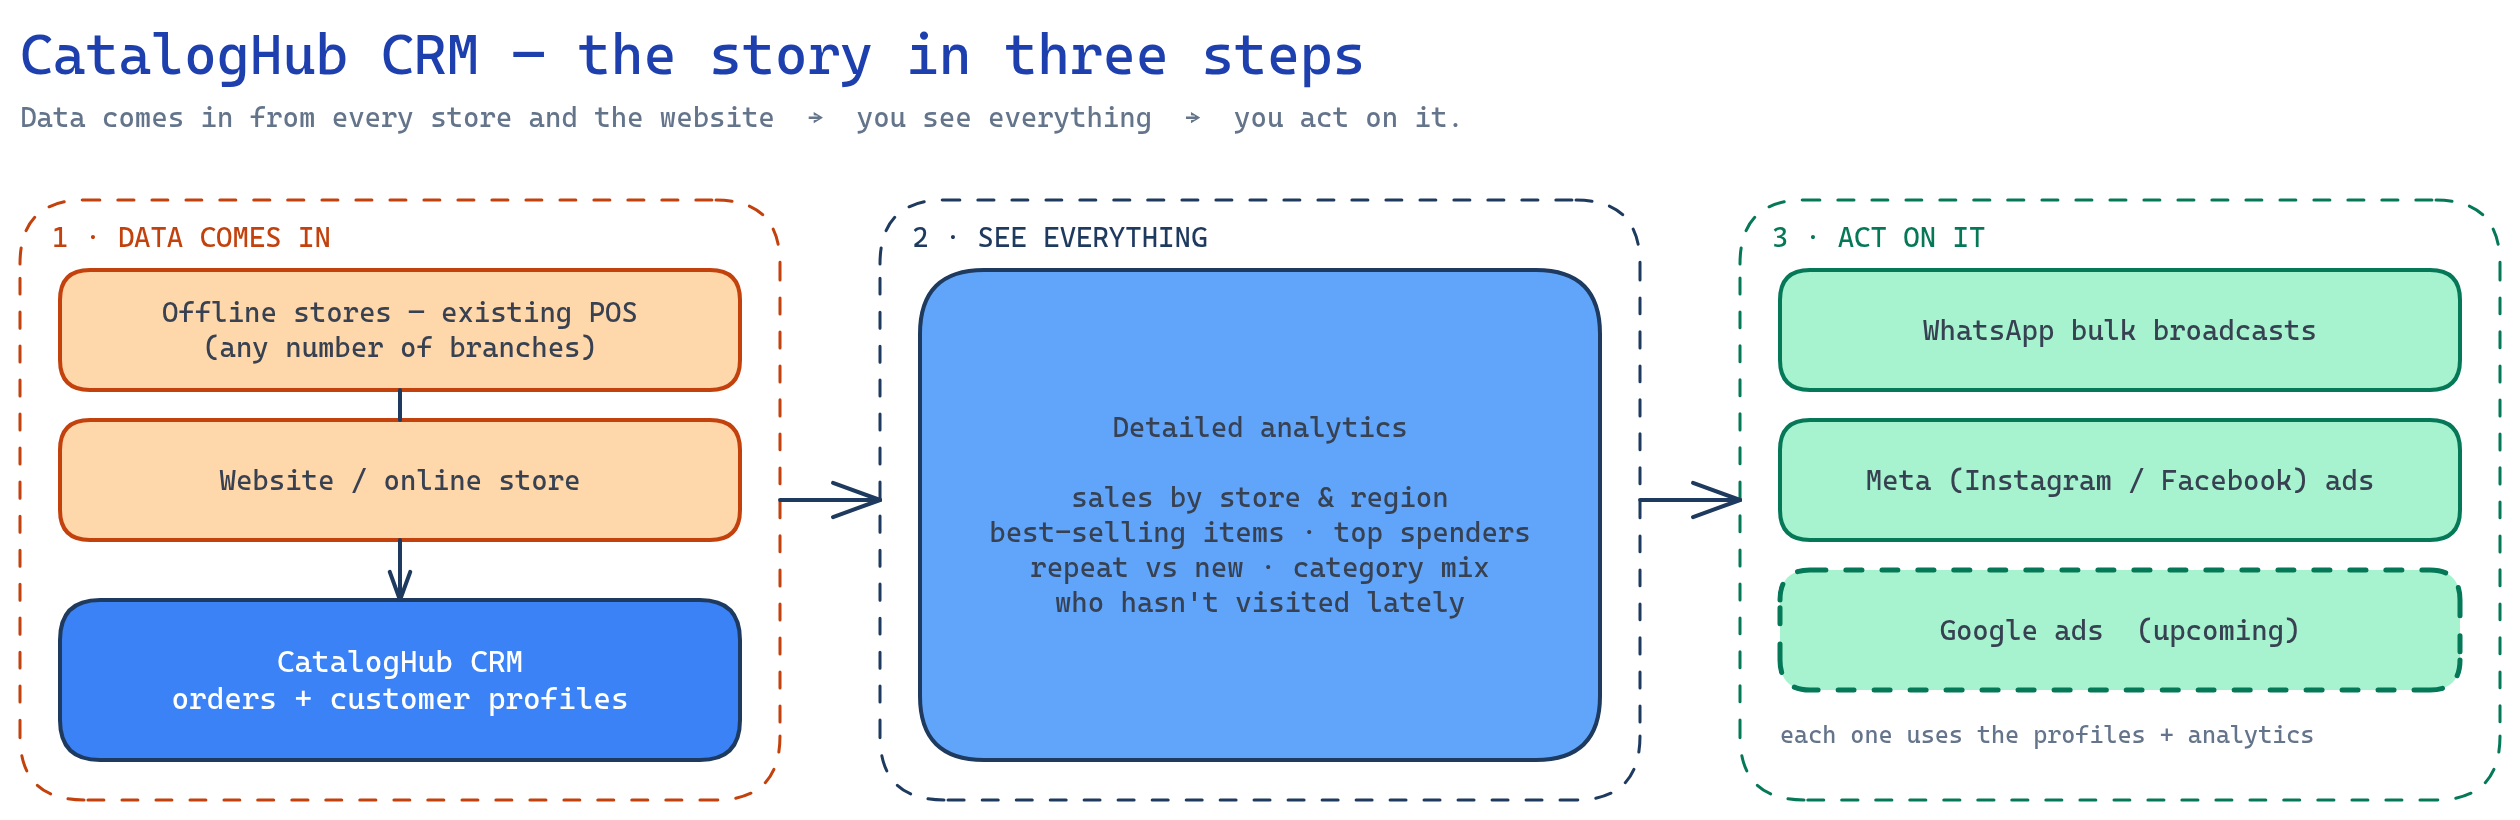
Diagram: 1 data comes in from offline stores' POS and the website into CatalogHub CRM; 2 detailed analytics; 3 act on it via WhatsApp bulk broadcasts, Meta ads and upcoming Google ads.
Fig 0 — overviewOpen in Excalidraw ↗
1

Data comes in

Bills from every branch's POS and orders from the website land in one CRM as orders and customer profiles.

2

See everything

Sales by store and region, best sellers, top spenders, repeat vs new, who's gone quiet.

3

Act on it

Pick a segment from the analytics and reach it: WhatsApp broadcast, Meta ads, Google ads (upcoming).
Step 1Data comes in

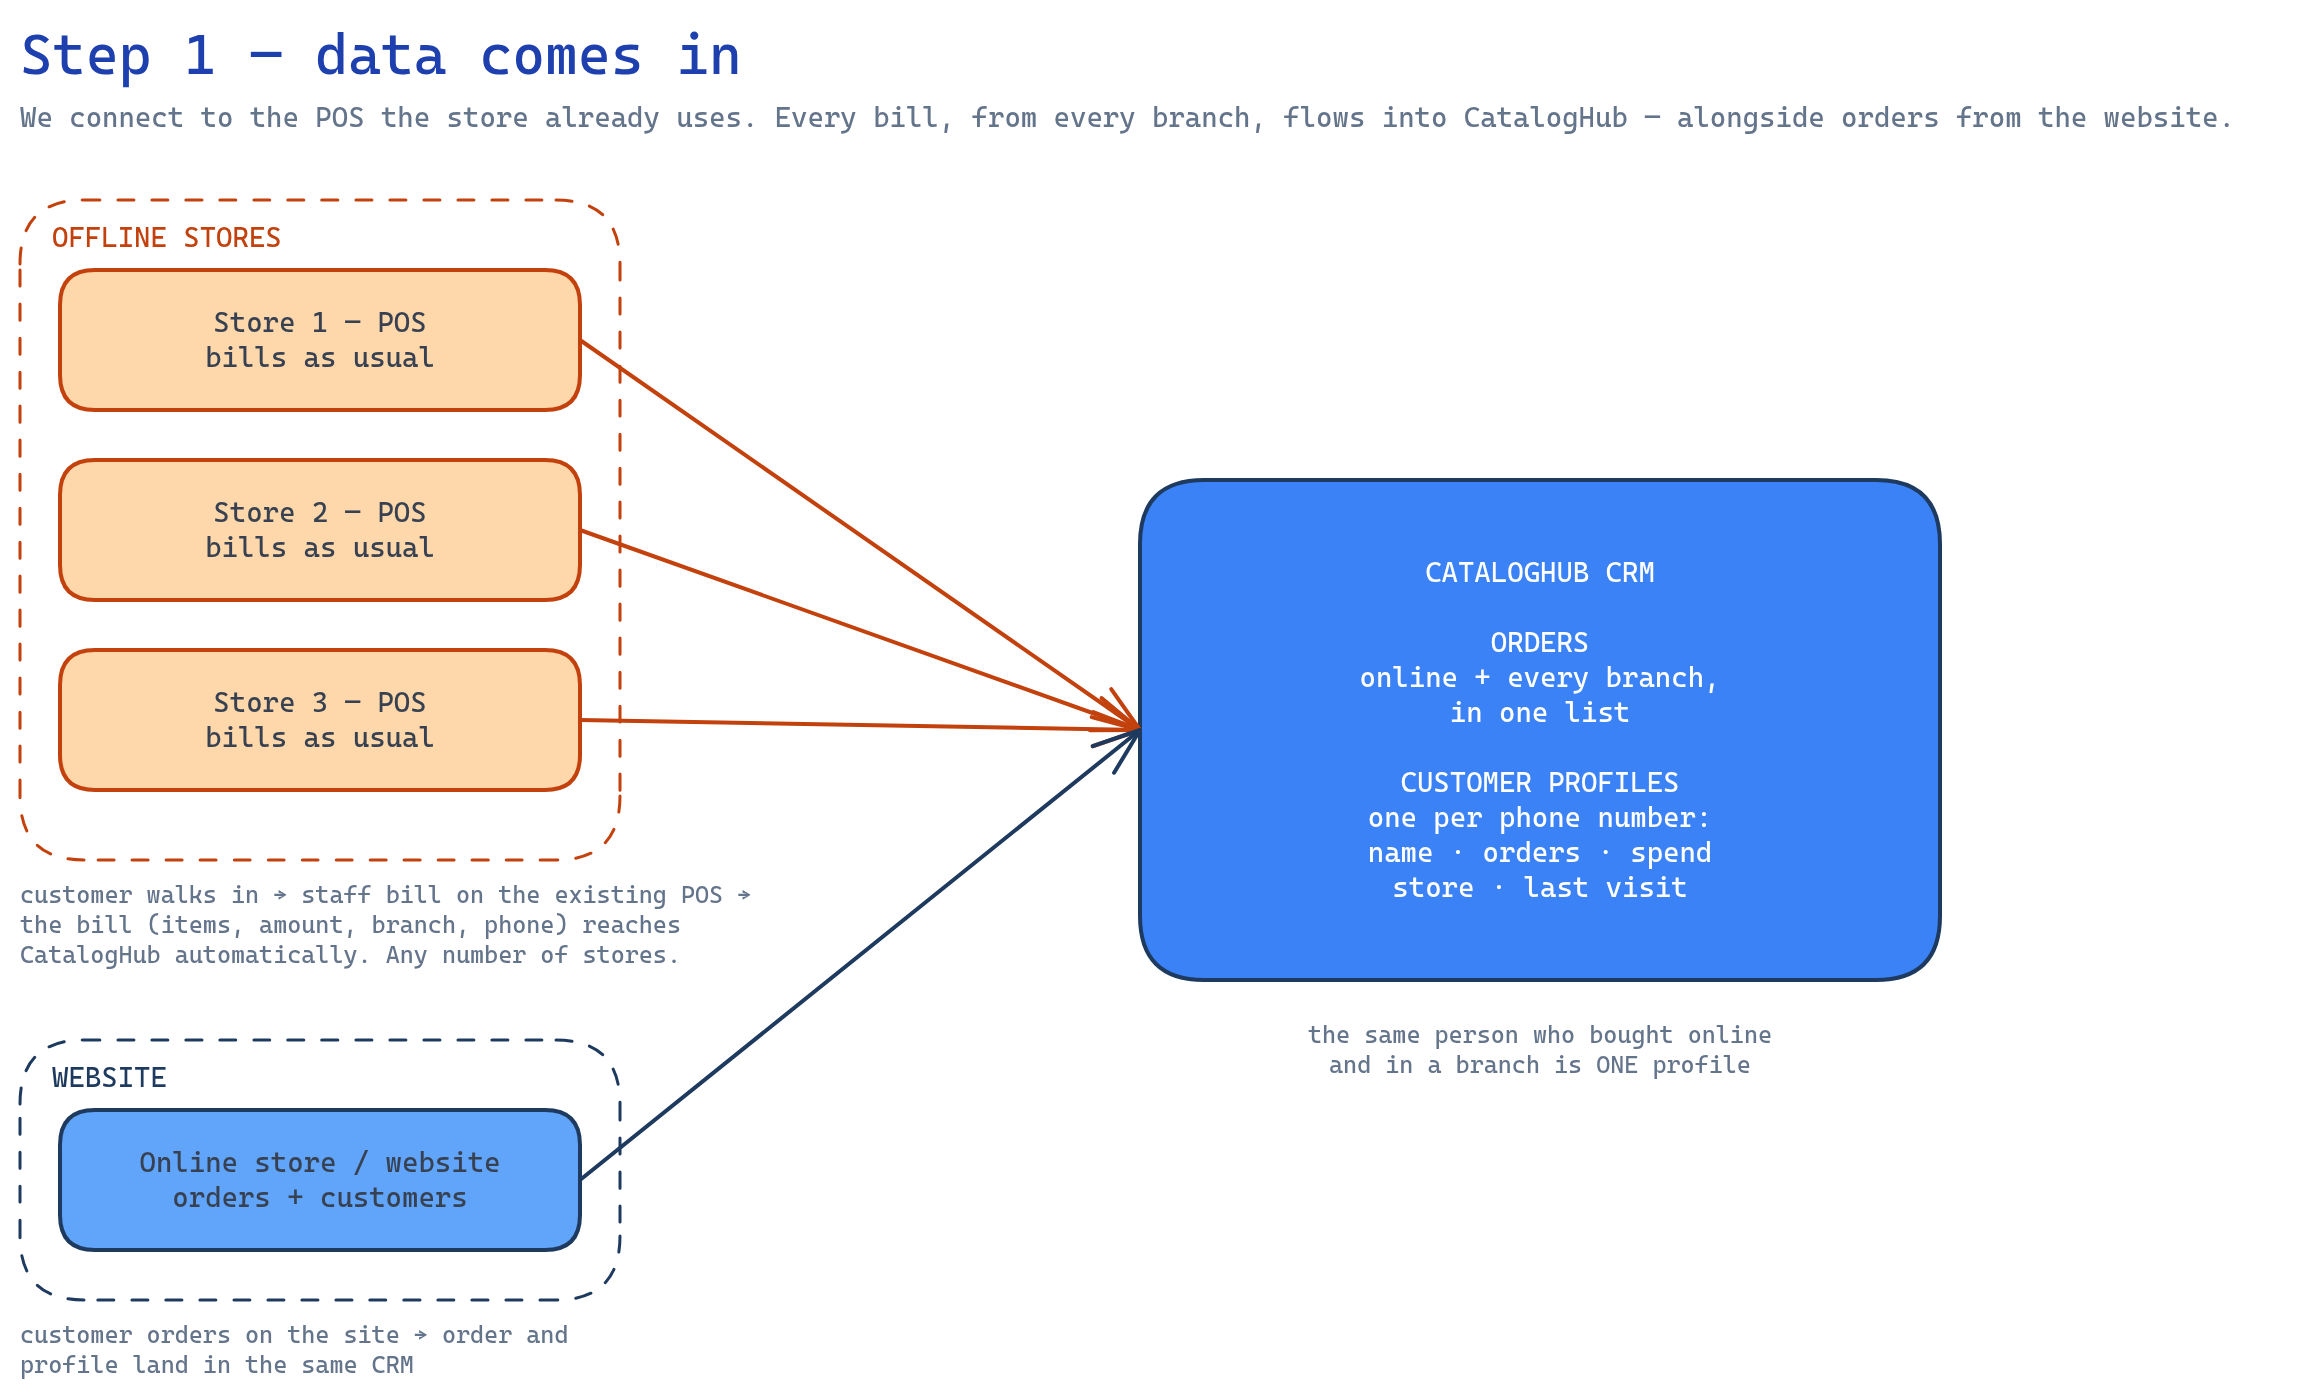
We connect to the POS your stores already use. Nothing changes at the counter — staff bill as usual, and every bill reaches CatalogHub on its own. Your website's orders and customers come in the same way. Connect one store or a hundred.

Diagram: Store 1, 2, 3 POS and the website all send orders into CatalogHub CRM, which holds orders in one list and one customer profile per phone number.
Fig 1 — data comes inOpen in Excalidraw ↗
Orders

One list, every channel

Online and every branch, side by side — with store, items, amount and customer on each.

Customer profiles

One profile per phone number

Name, orders, spend, which store, last visit. The person who bought online last year and walked into a branch this week is one profile, not two.

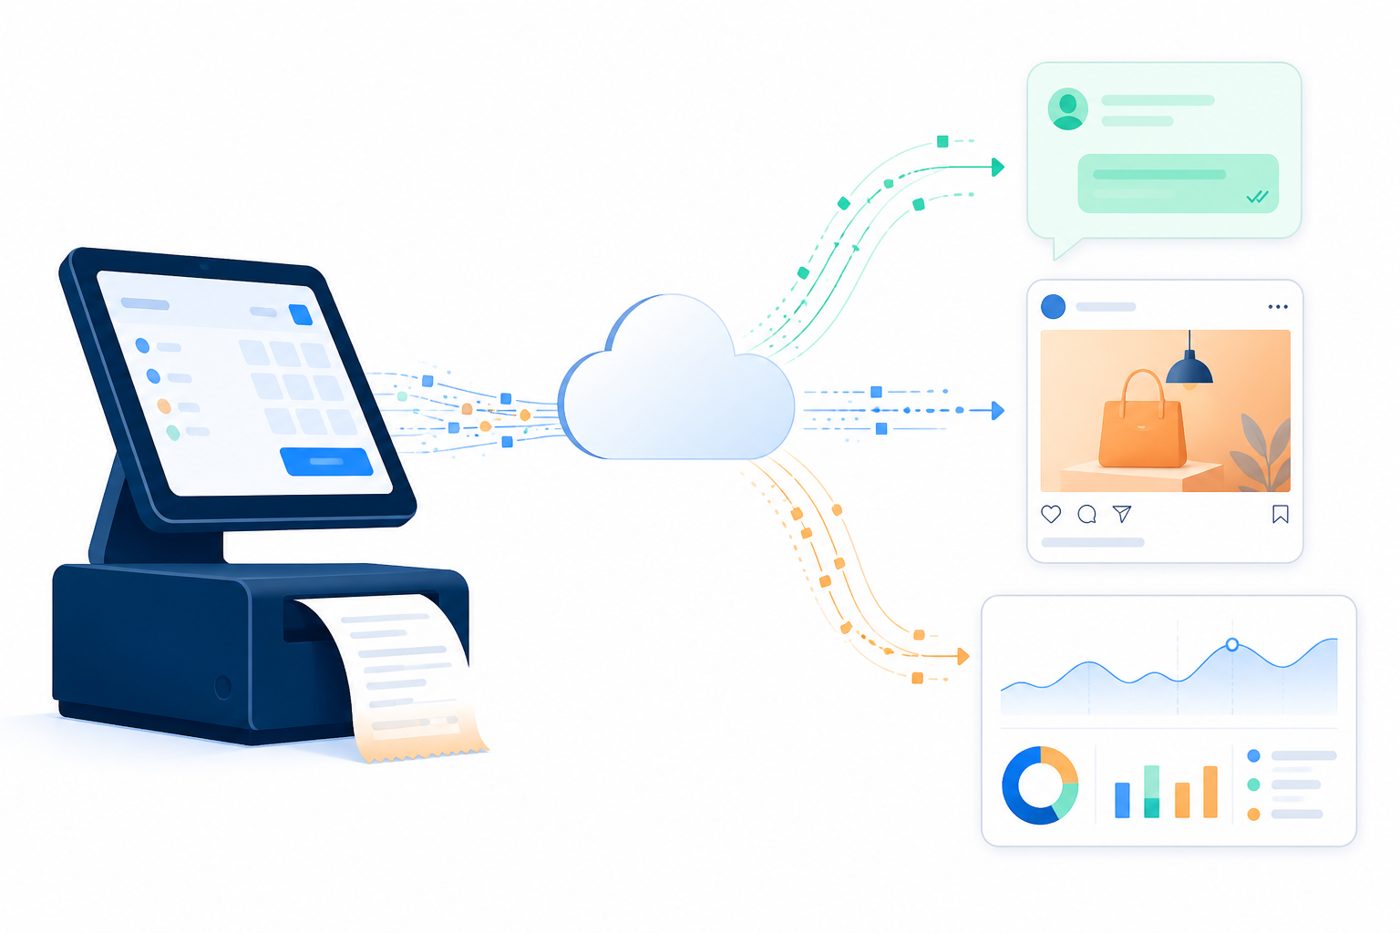
Illustration: a billing counter's data flowing to the cloud and fanning out into WhatsApp, ads and analytics.

Step 2See everything

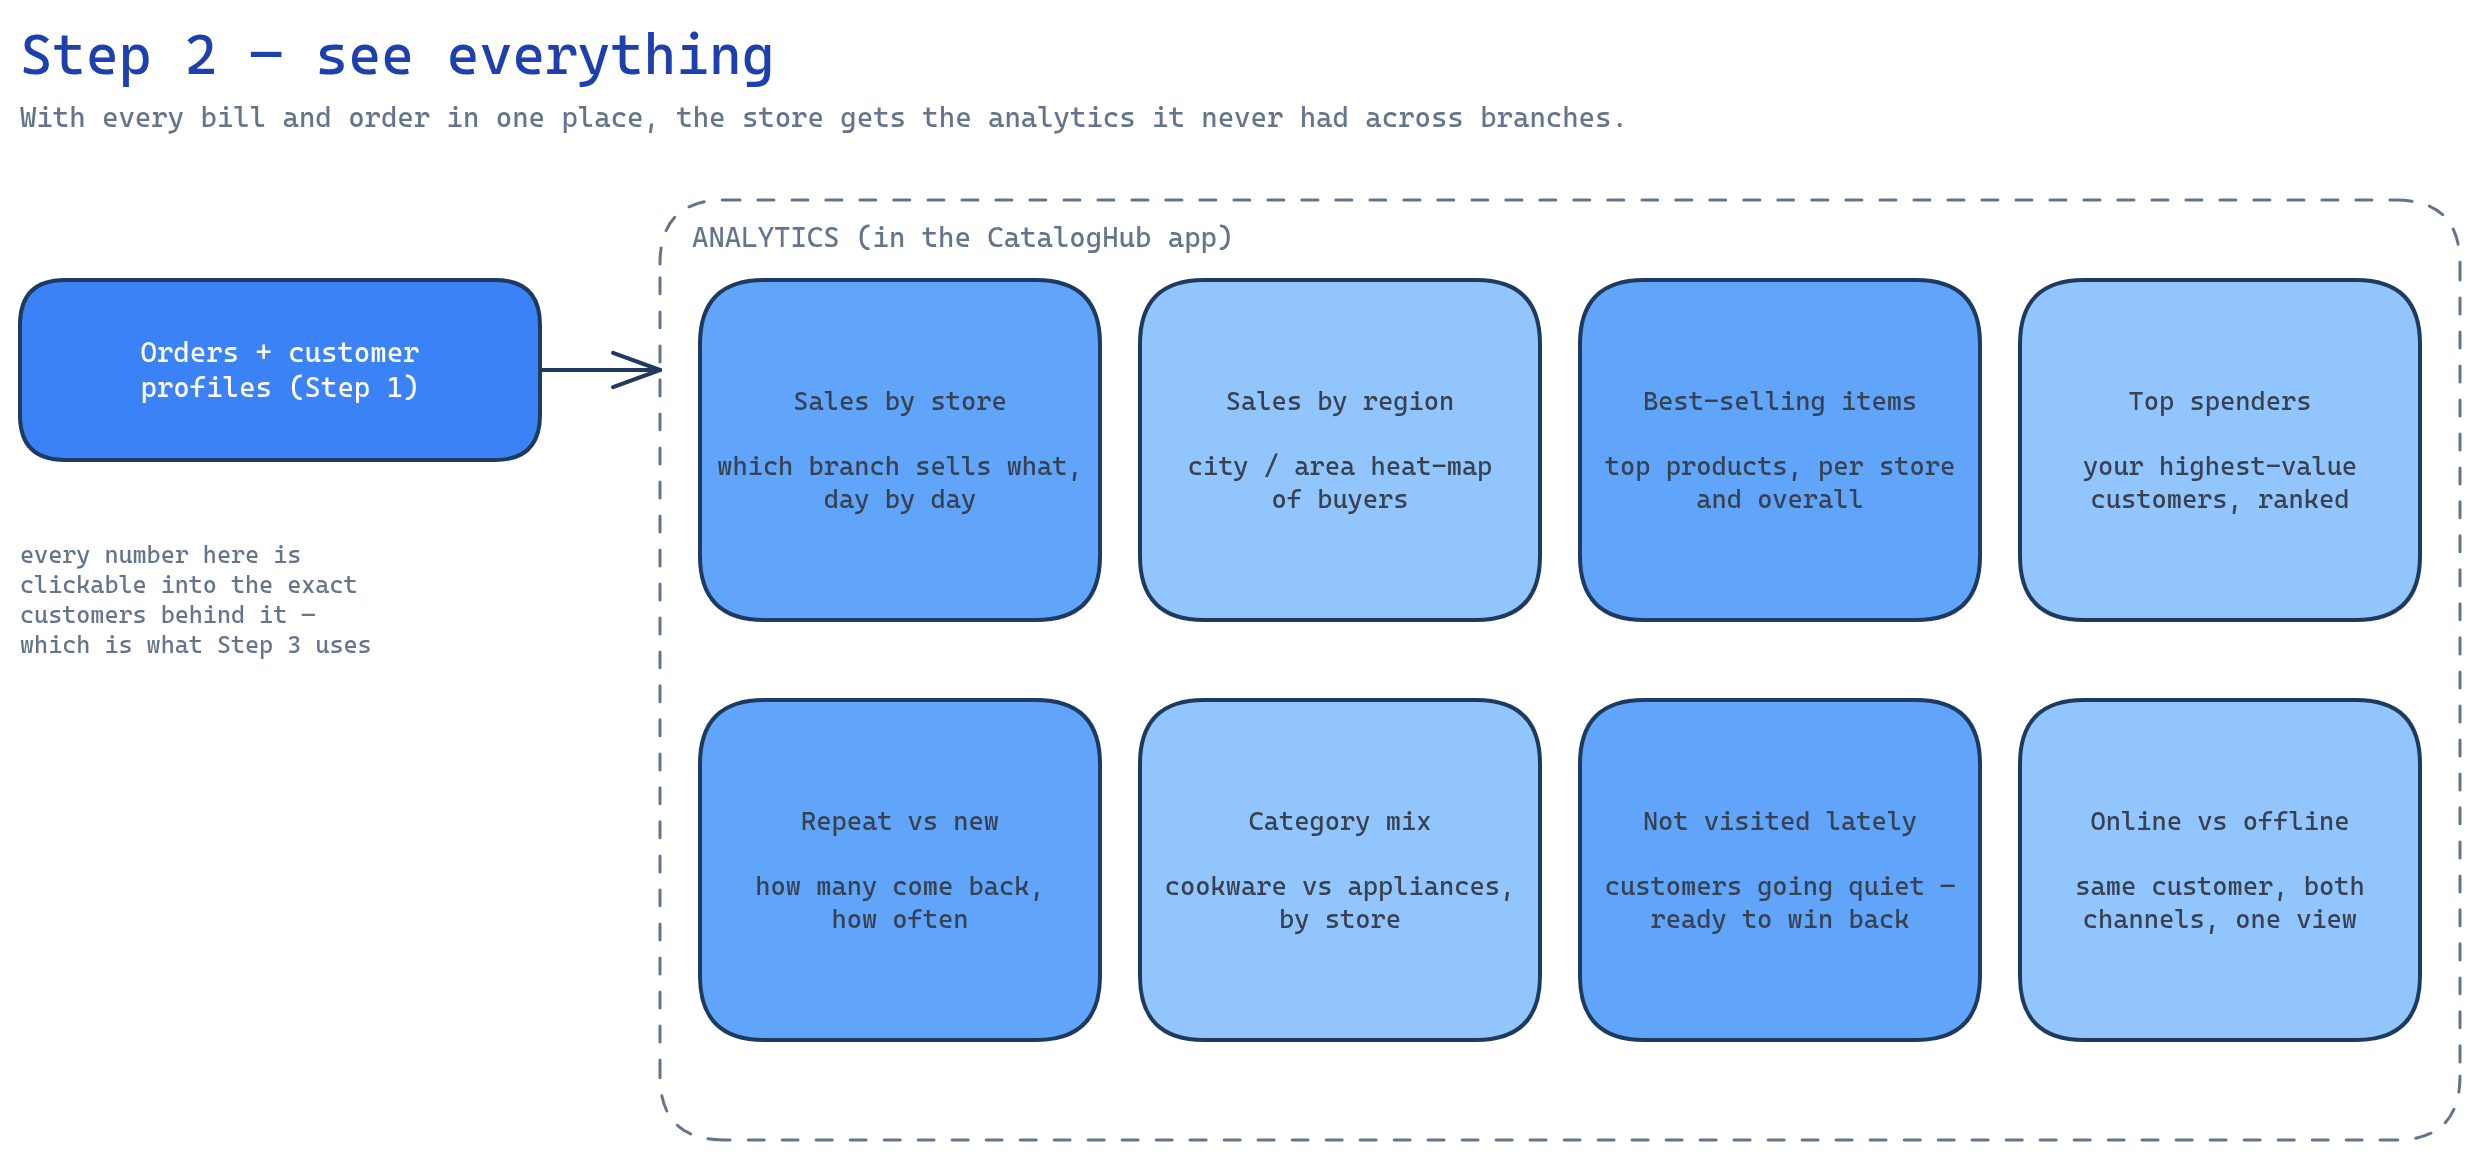
With every bill and order in one place, the store gets the analytics it never had across branches.

Diagram: eight analytics tiles — sales by store, sales by region, best-selling items, top spenders, repeat vs new, category mix, not visited lately, online vs offline.
Fig 2 — analyticsOpen in Excalidraw ↗

Sales by store & region

Which branch sells what, day by day; where your buyers live.

What sells

Best-selling items and category mix, per store and overall.

Who buys

Top spenders, repeat vs new, customers who've gone quiet, online vs offline.

Every number is clickable into the exact customers behind it — that list is what Step 3 acts on.

Step 3Act on it

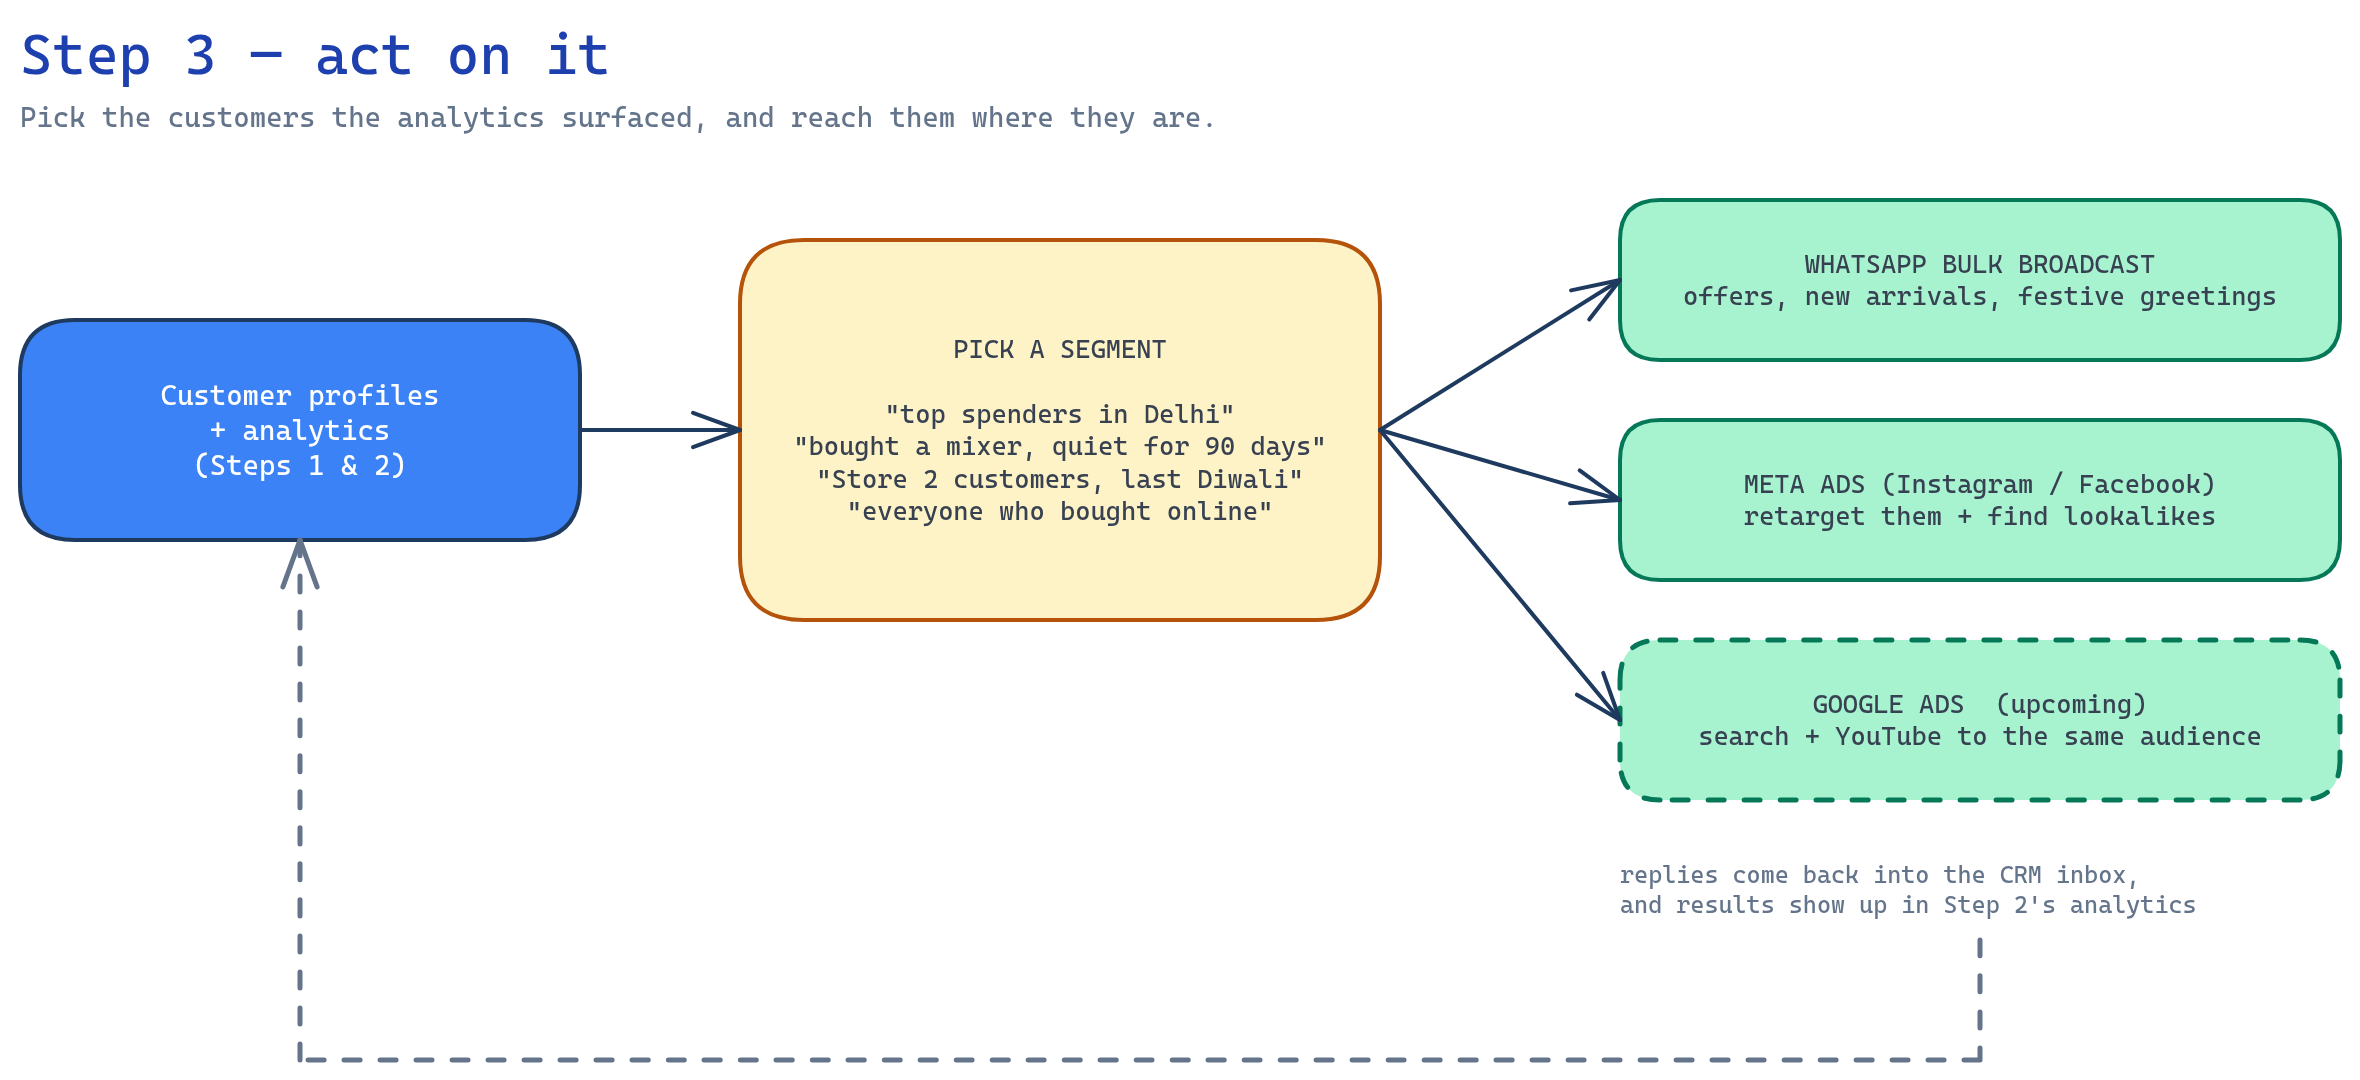
Pick the customers the analytics surfaced and reach them where they are.

Diagram: customer profiles and analytics feed a segment picker, which sends to WhatsApp bulk broadcast, Meta ads, and upcoming Google ads; replies and results flow back into the CRM.
Fig 3 — outboundOpen in Excalidraw ↗
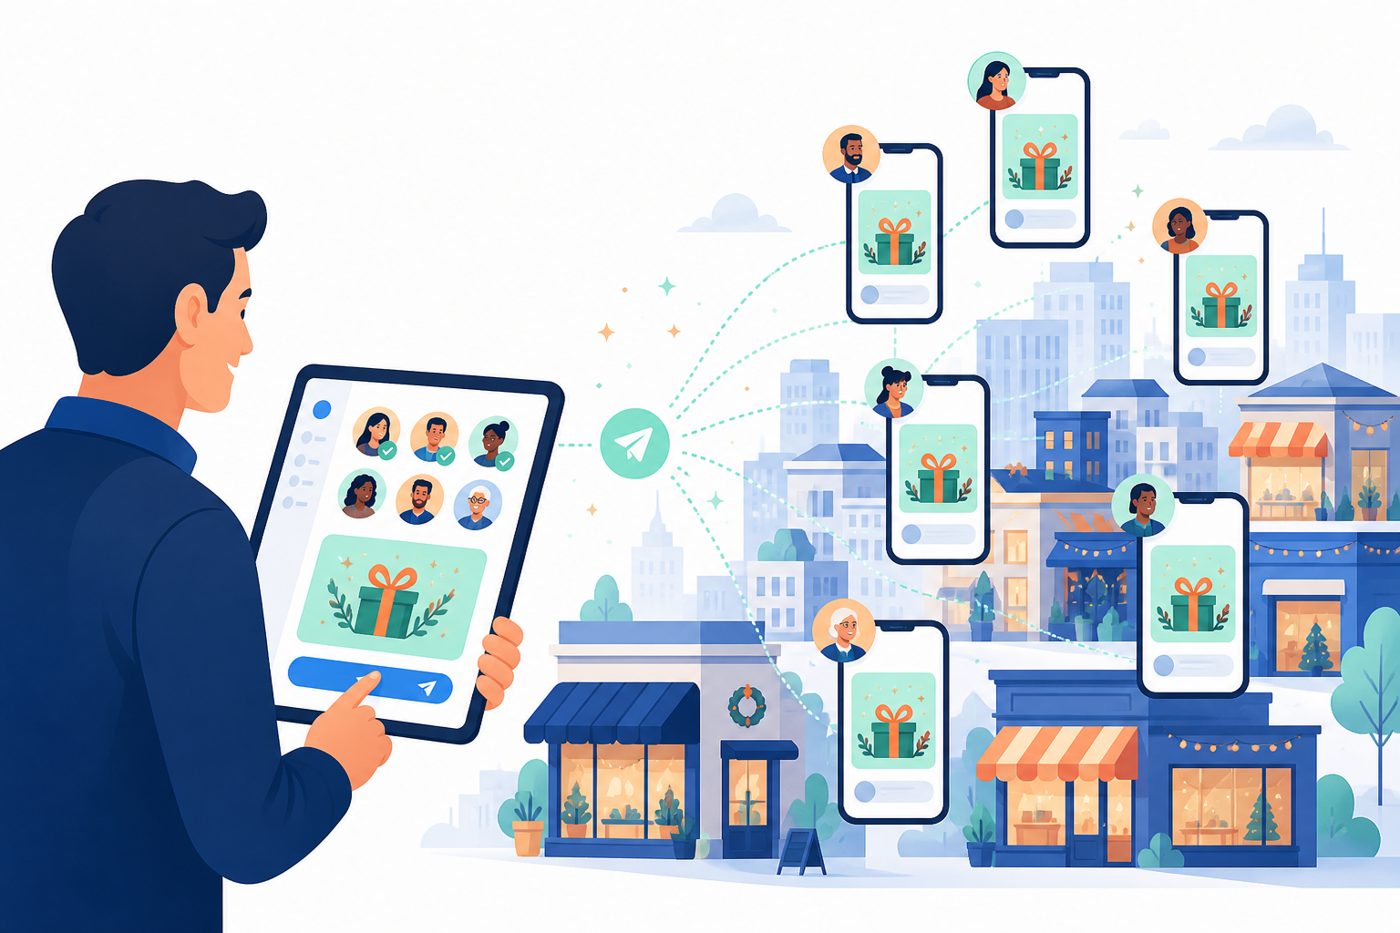
Illustration: a store manager on a tablet sends one festive message that appears on many customers' phones.
WhatsApp

Bulk broadcasts

Offers, new arrivals, festive greetings — to "top spenders in Delhi" or "Store 2 customers from last Diwali". Replies come back into the CRM inbox.

Meta

Instagram & Facebook ads

Retarget your own customers and find lookalikes — people similar to your best buyers.

Google · upcoming

Search & YouTube ads

The same audience, reached on Google. Results flow back into Step 2's analytics.